
 Sign In
This article is about Data Science
How to Clean Data Using Pandas and Numpy
By NIIT Editorial
Published on 11/08/2021
8 minutes
So today, we are going to use PyCharm(a development environment that is integrated and developed for Python). If you are a beginner, you can use this preferred tool for streamlining the generation of virtually enabled environments. You can also install certain Python packages like Pandas.
Utilizing virtual environments enables you to handle your dependencies of your project without affecting the default installation of Python for your operating systems.
To begin with, Open PyCharm, select the file, and go to the new project from the navigation bar. At this stage, you can give a name to your project with the help of a location or create a whole virtual environment that is new or maybe a testimonial to the one already existing.
To commence, below, we have built a Python script base along with a CSV file. ( All two files will be referred to in the entire guide) You can download each of these files and save them to the main project directory. You can get the finalized script here.
We are using an employee record data during in this article which has following details :
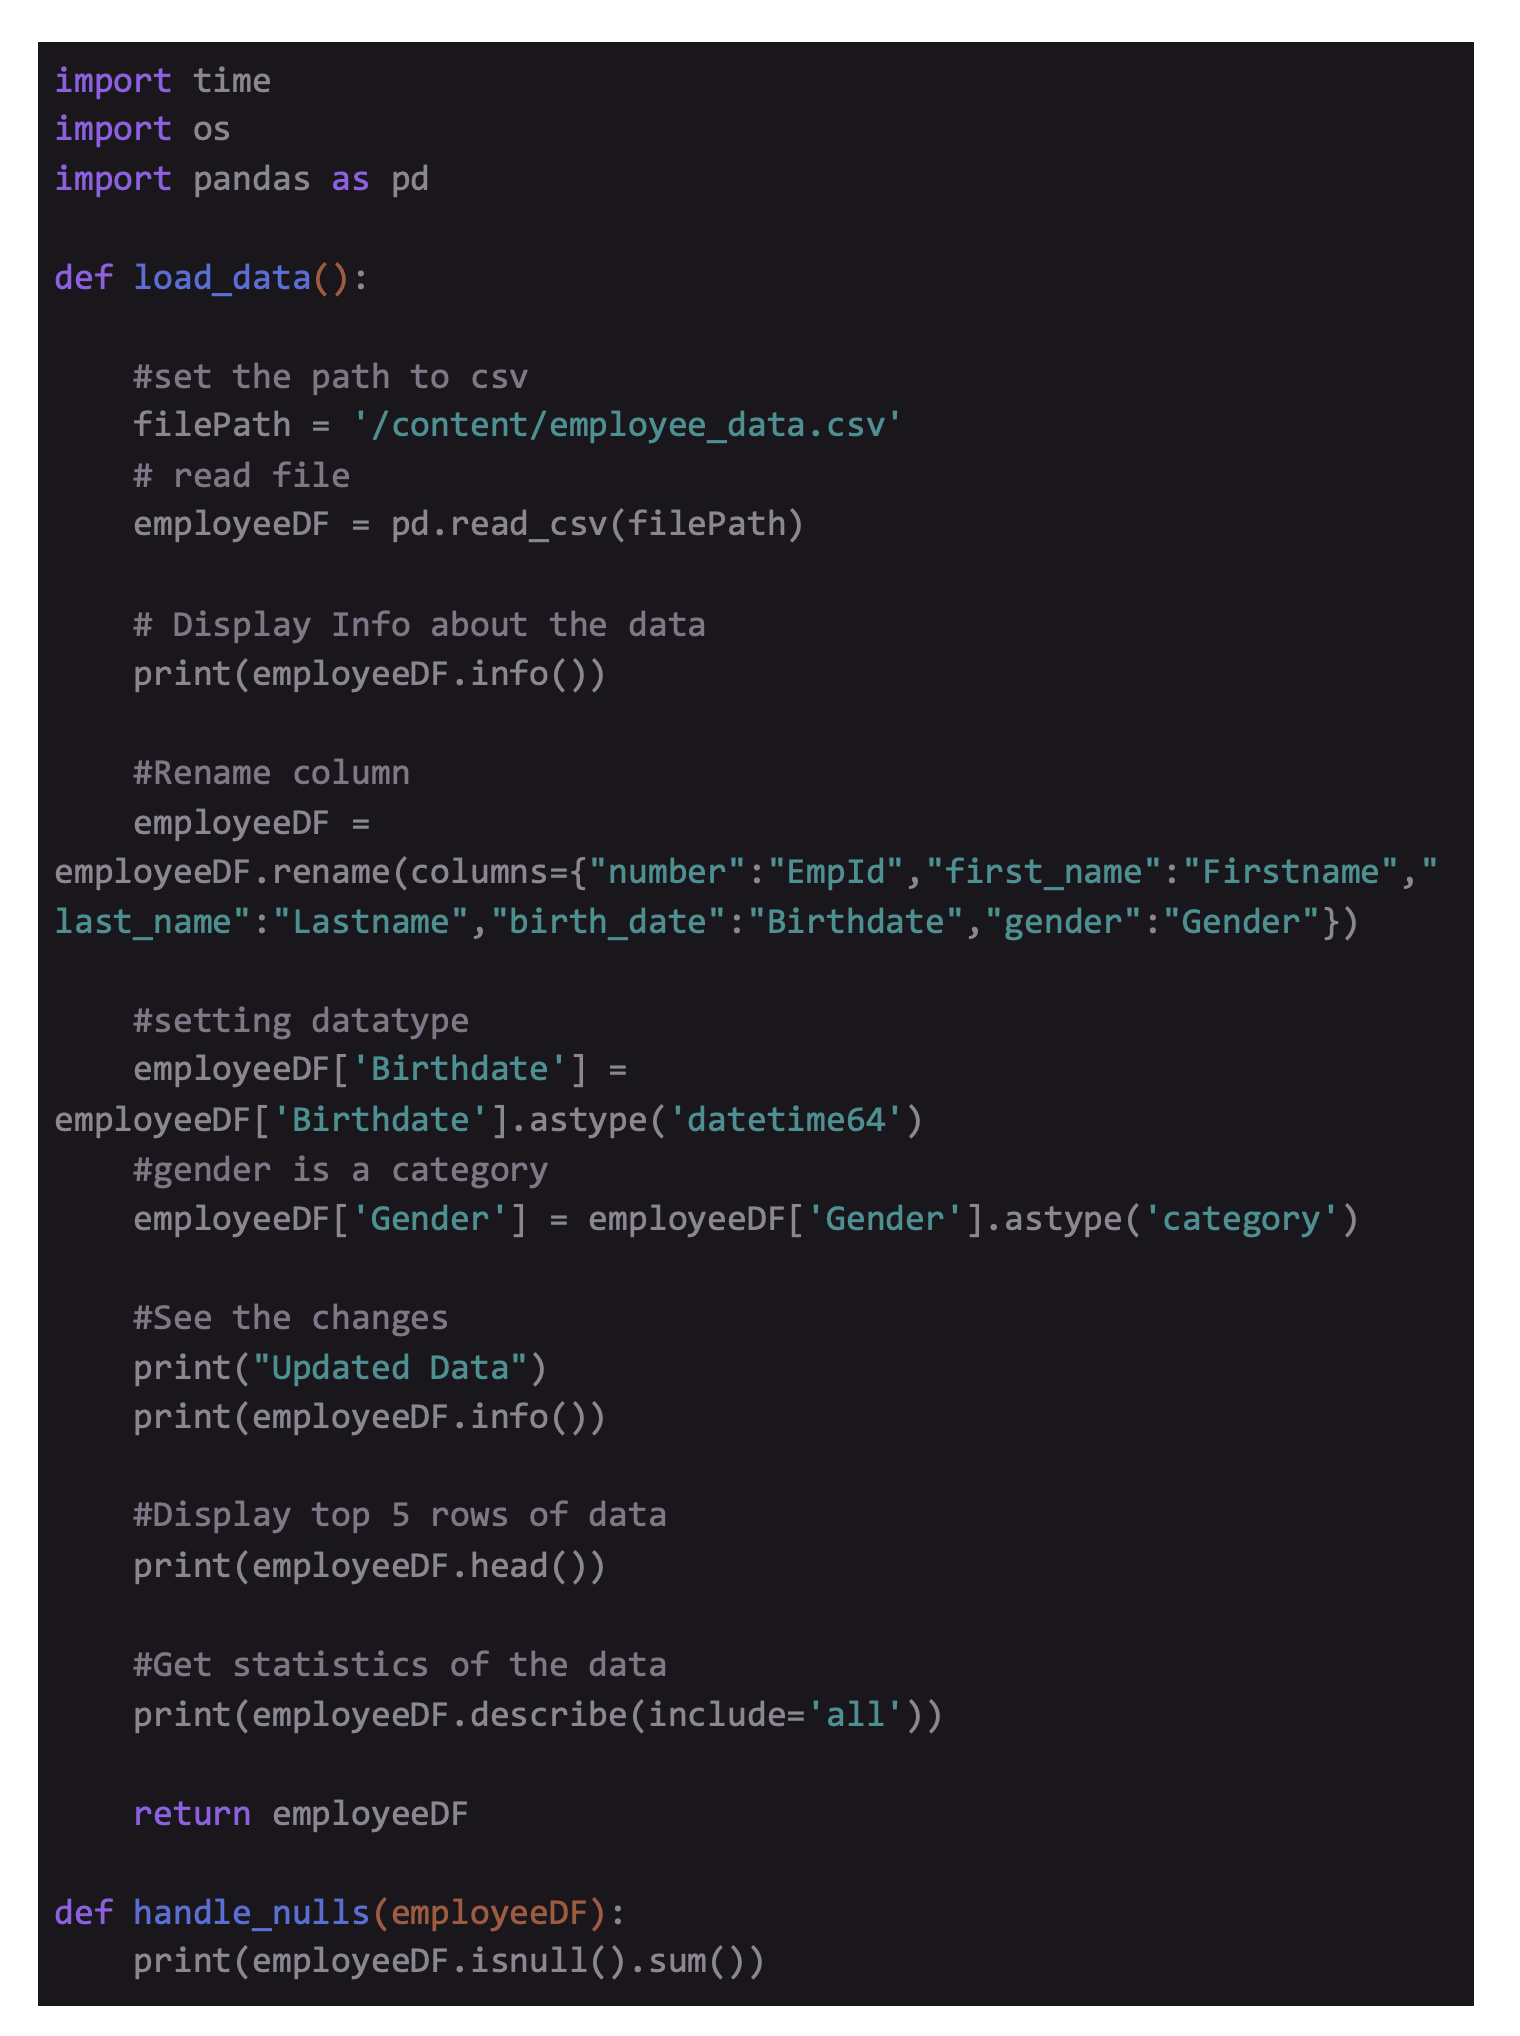
Code to load and understand the data :
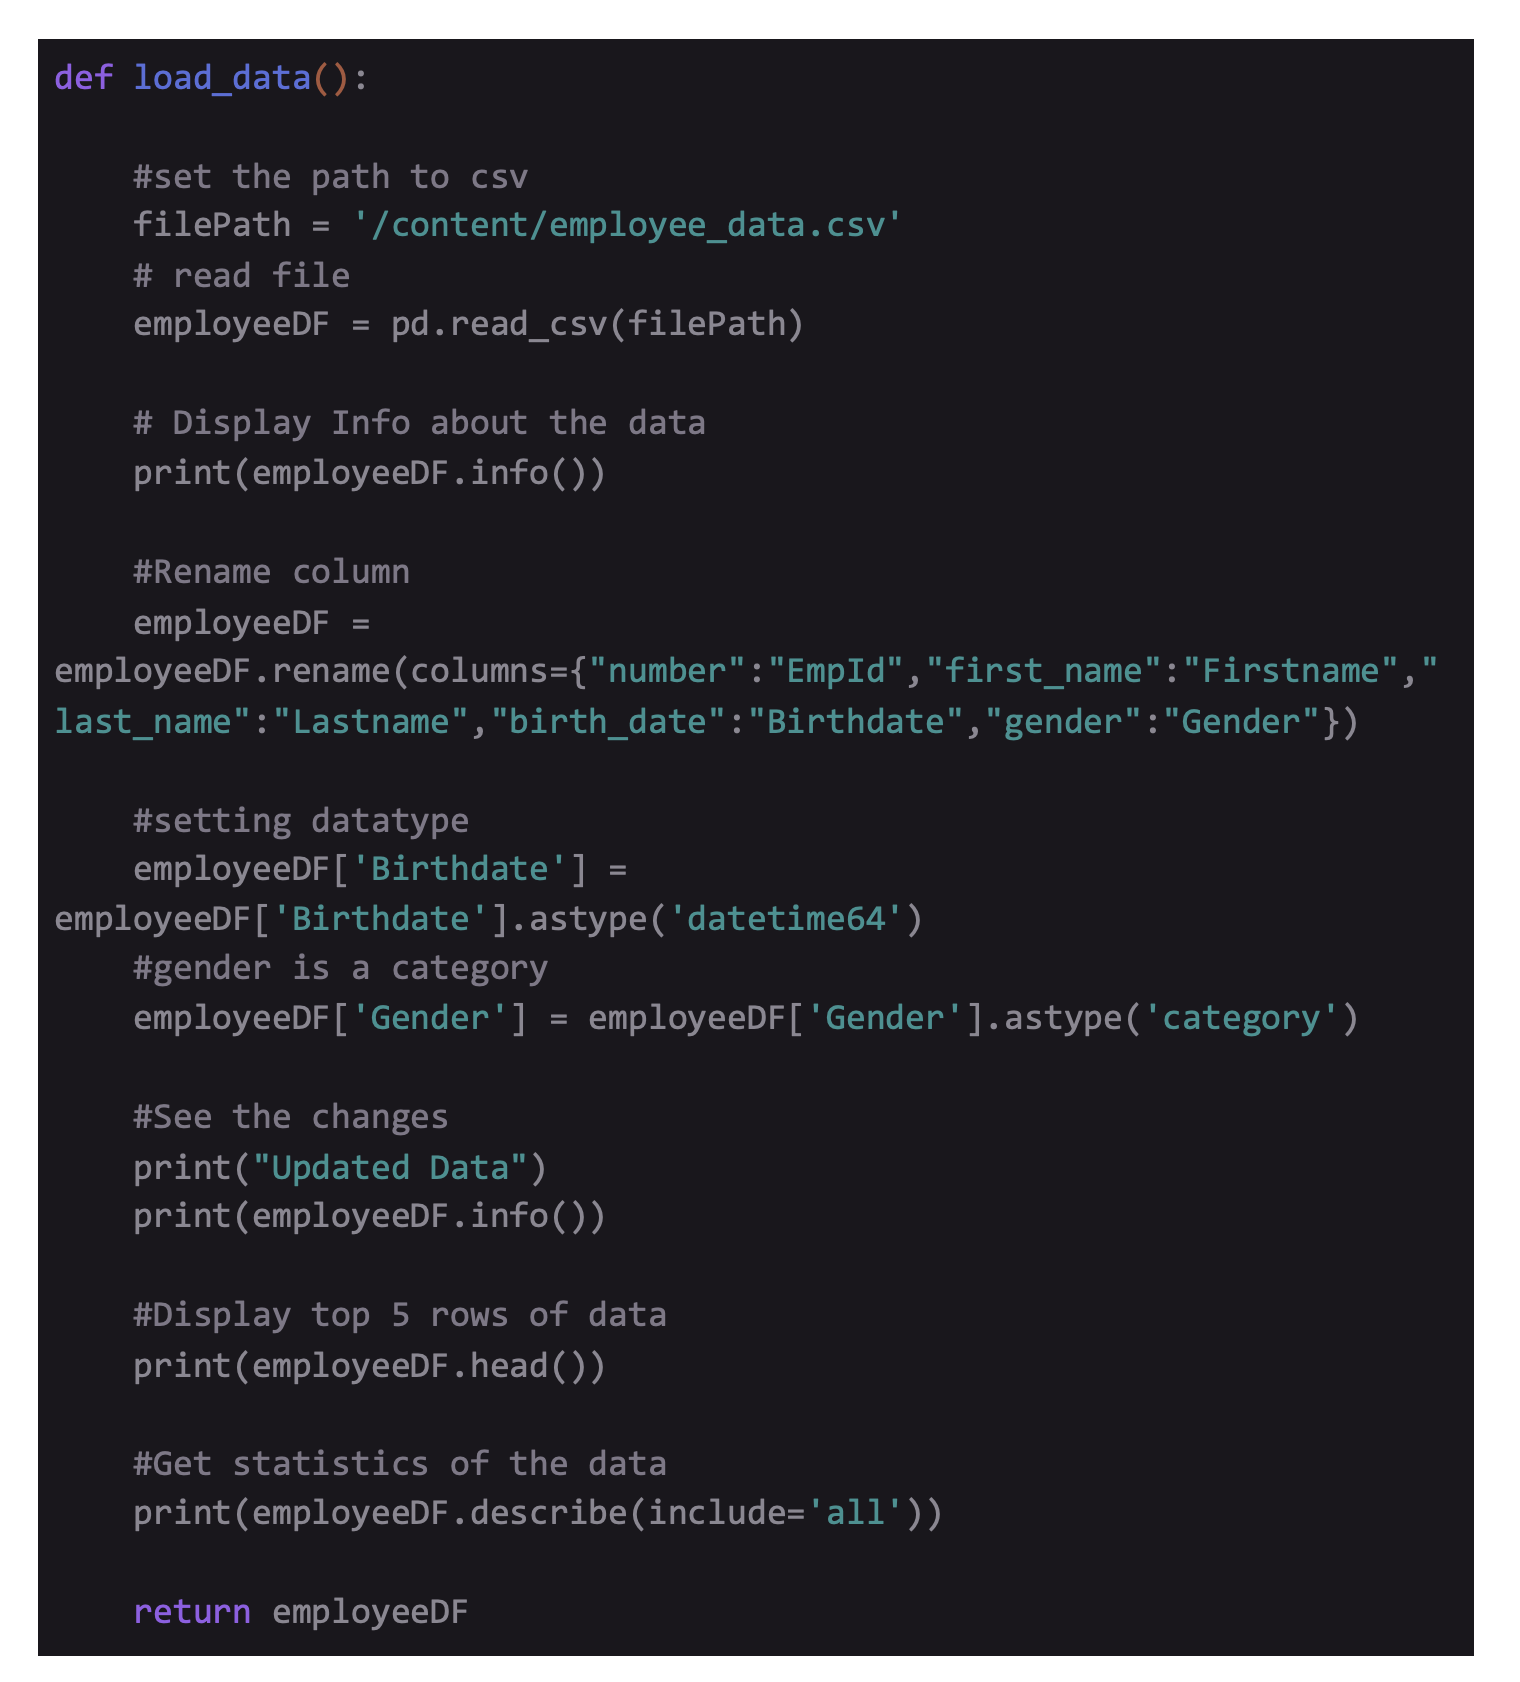
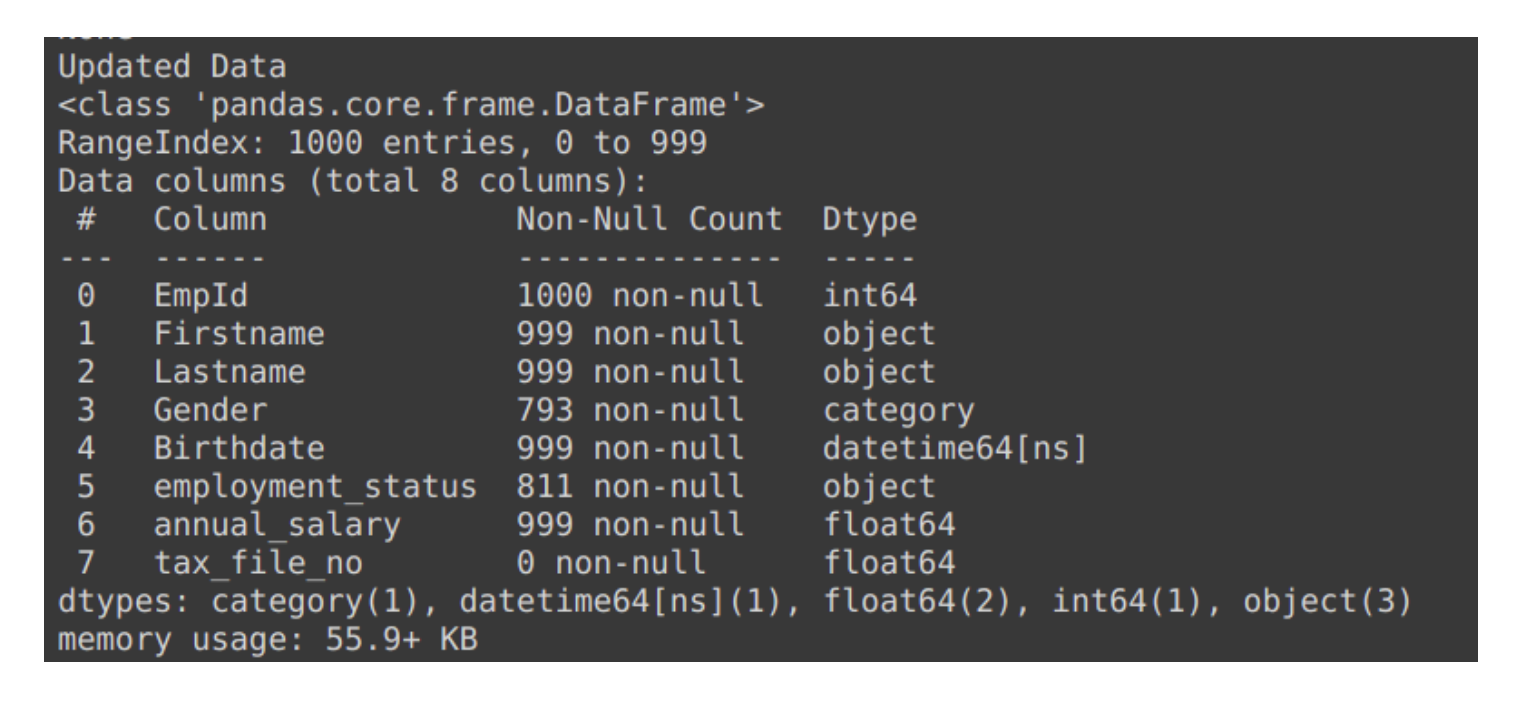
The script above denotes several DataFrame manipulations next to the reading process of the file into the alloted memory. To allow data reading in the allocated memory, we are using built-in Pandas function read_csv() that obtains the name of the file in the form of a parameter. We are also setting the type of data of 3 columns. Doing this offers exclusive benefits, including enhancing the performance by lowering memory footprint and enriching the descriptive output of statistics that we obtain while running built-in Pandas function .describe(). Later, you rename a column which is usually essential to transforming the general name of the column name to something relevant.
Cleaning of the DataFrame
To get a clear knowledge of which features of a dataset require cleaning, you first have to check the nature of the data. You can do this by using Pandas built-in functions .info() and .describe().
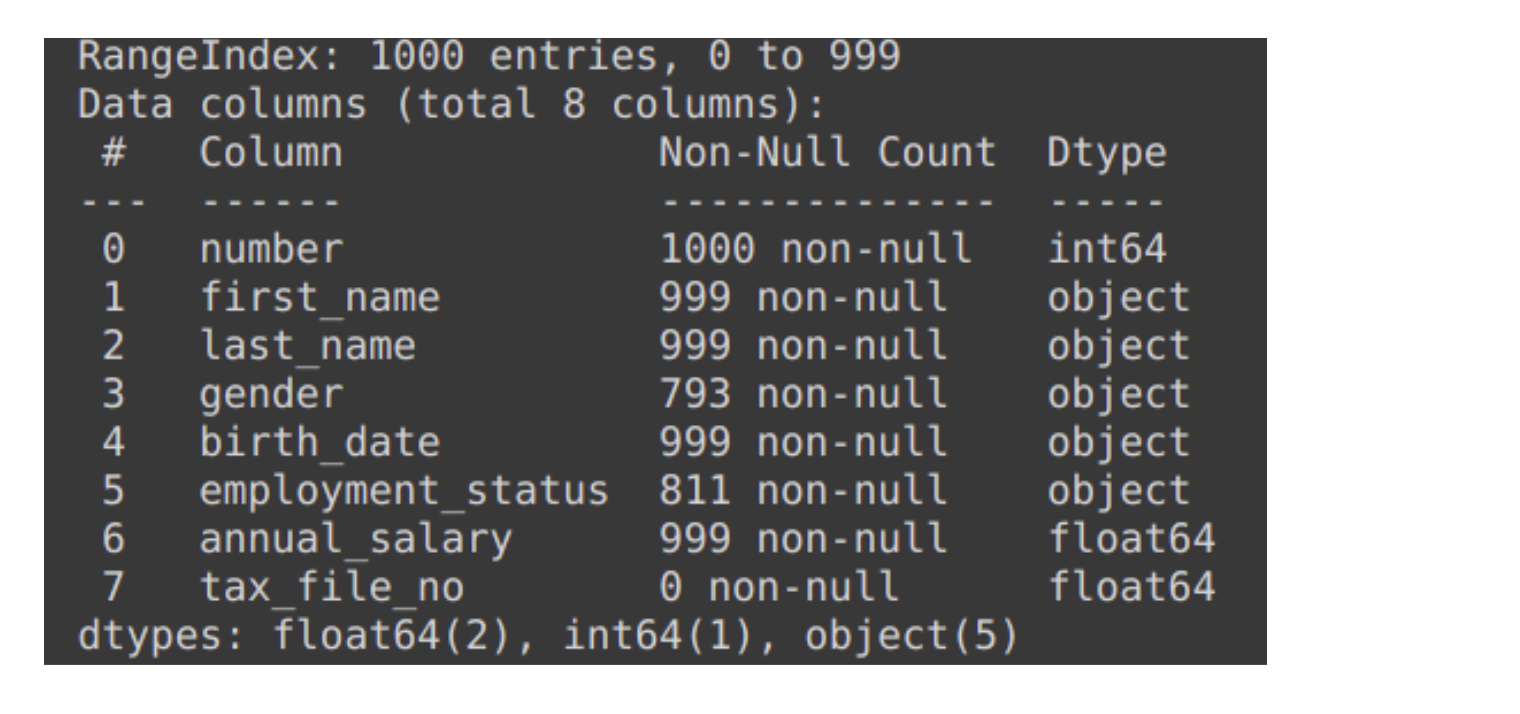
Details of data using .info() :
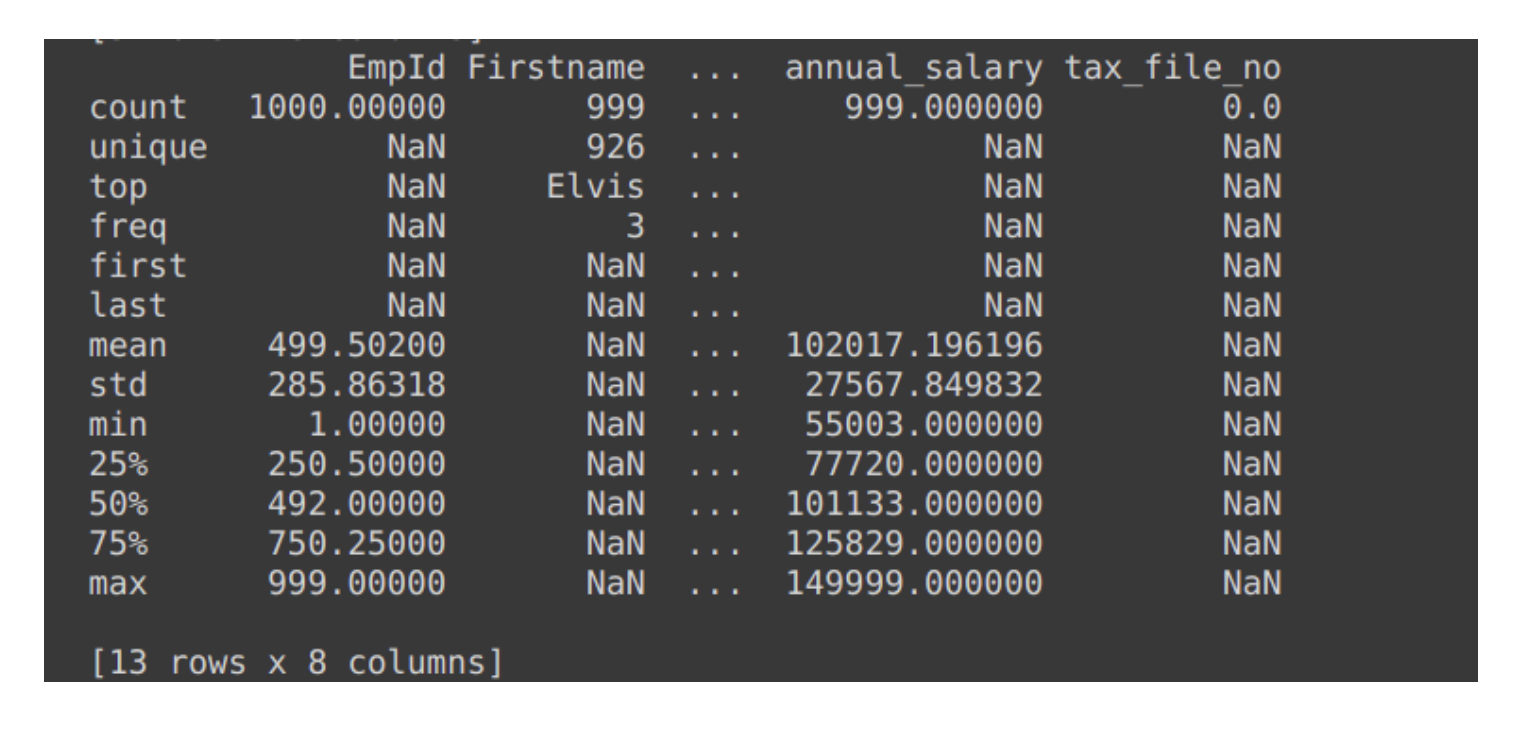
Details of data using .describe() :
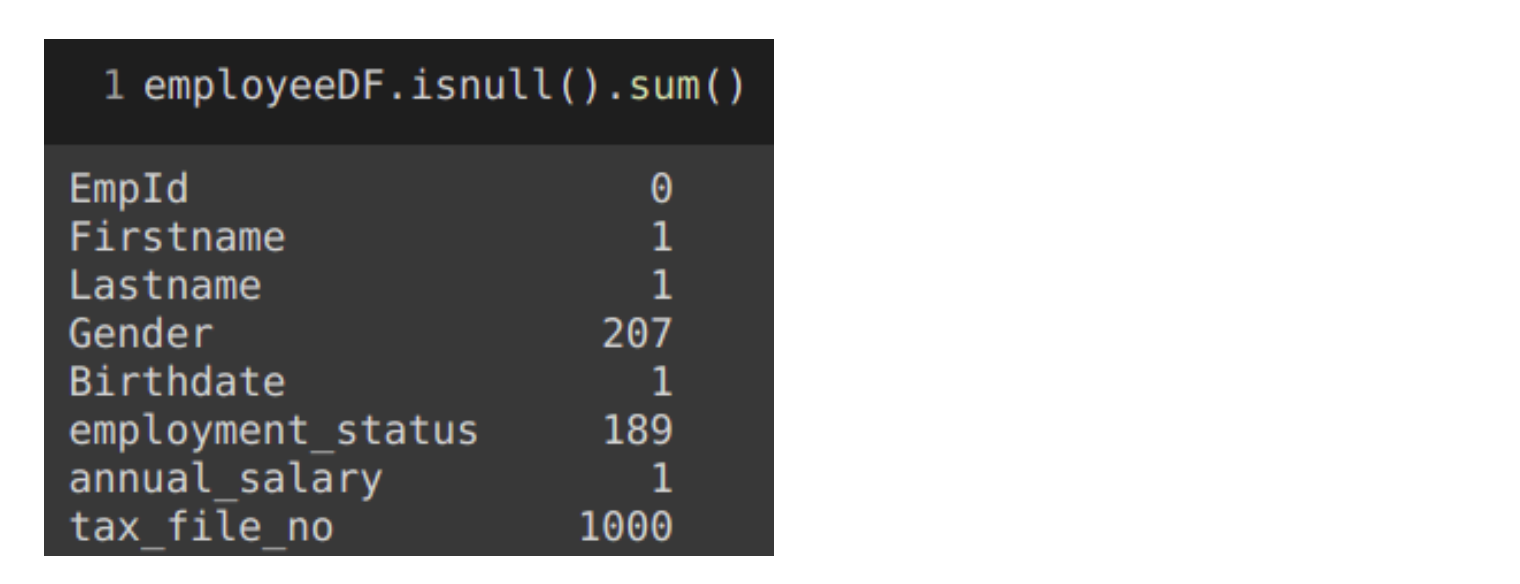
The output of .info() clearly states the quantity of non-null elements. Hence, determining the number of null elements is possible with the help of RangeIndex from the first line. To sum up, calling df.isnull().sum() adds the amount of null elements present in each column.
In case, you wish to know the null elements' percentage in the form of a percentage, for the entire dataset, do the following:
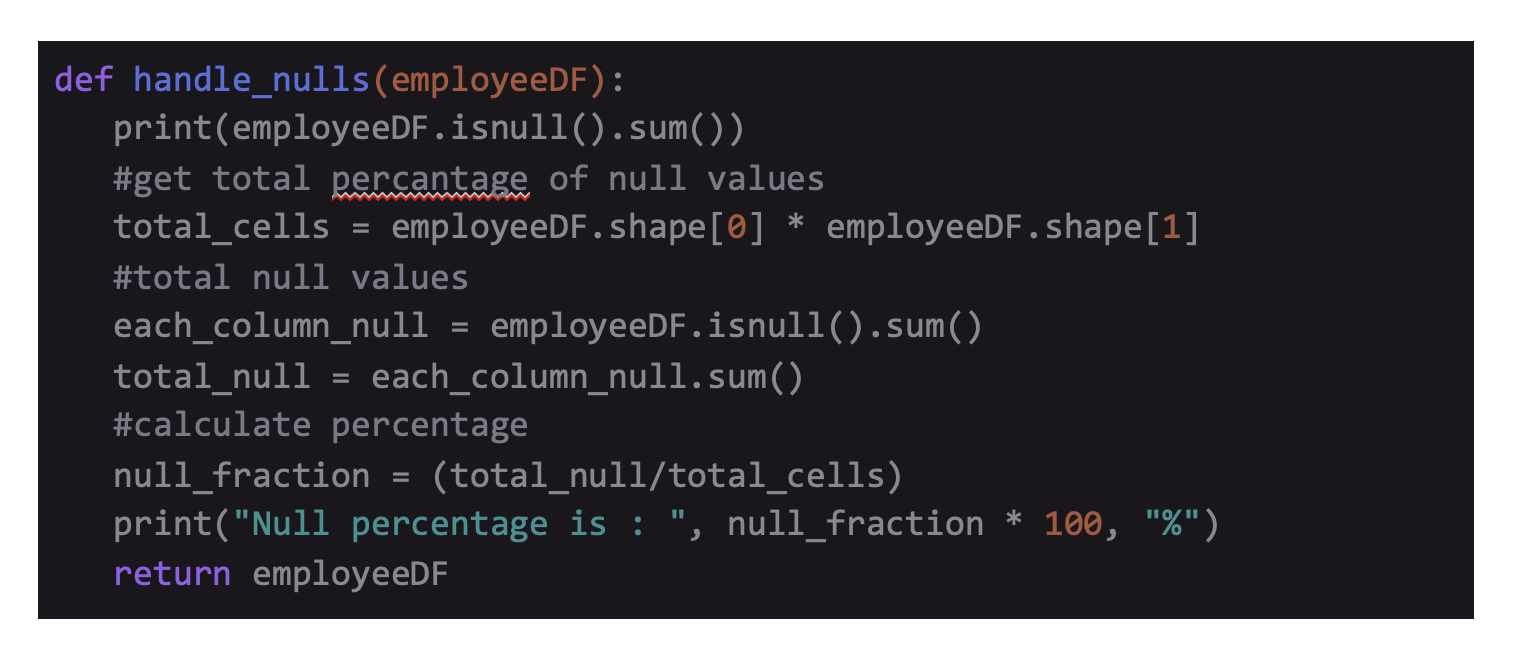
Output :

Removal of Columns
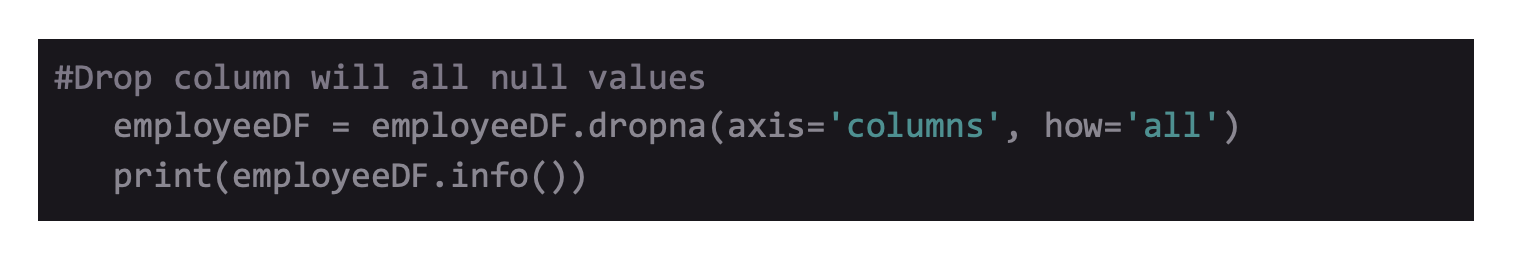
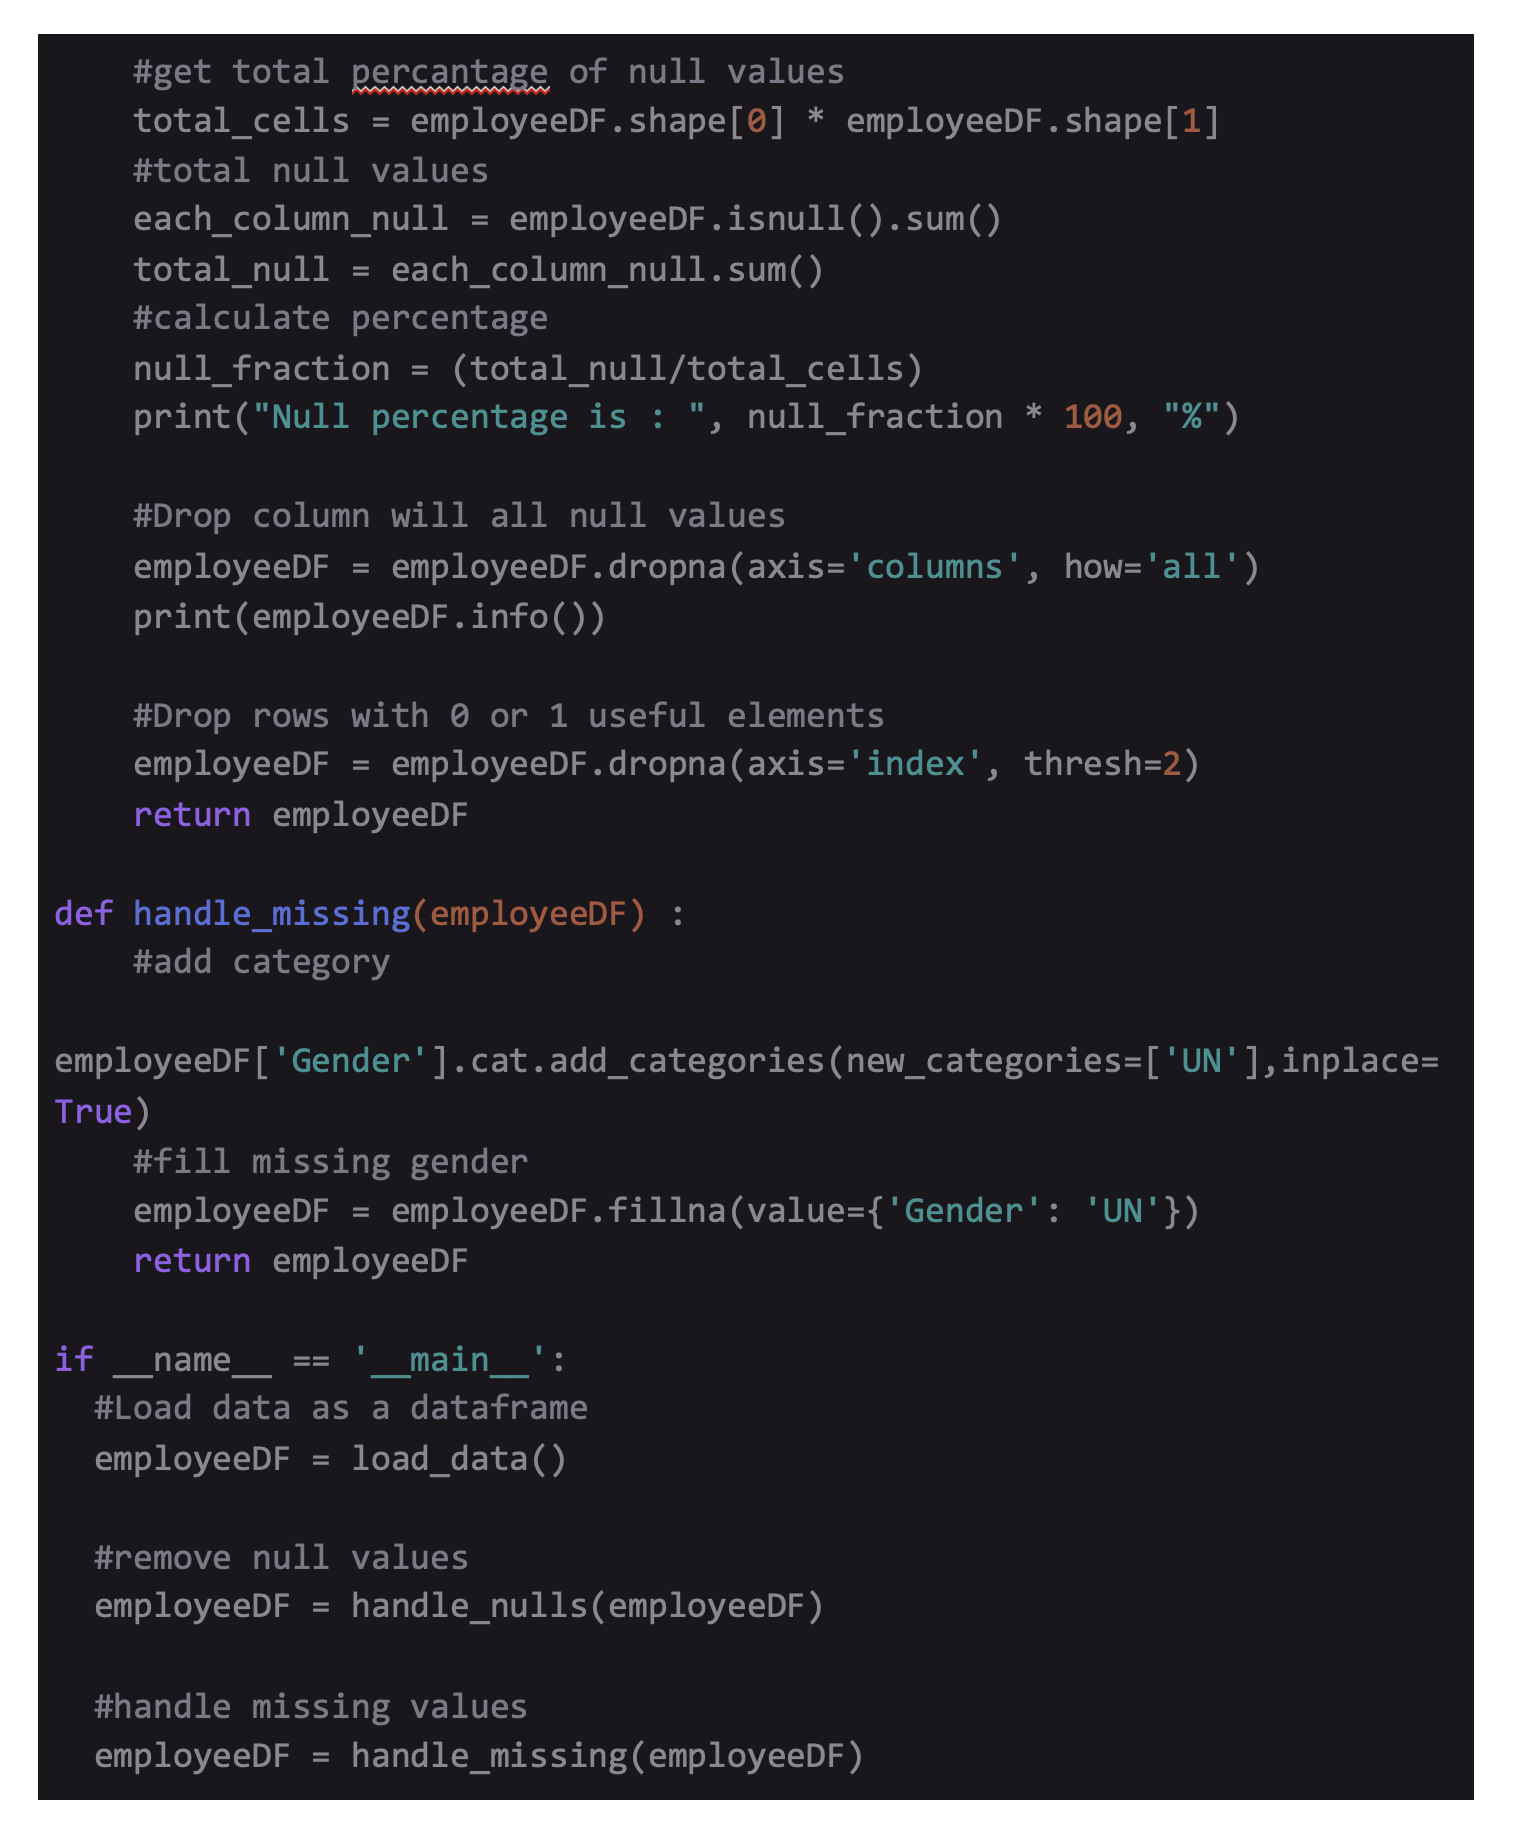
After calling .info() and .isnull().sum(), one element that comes out is the tax_file_no that owns 1000 null values across 1000 records. The simplest method to eliminate these rows is by using Pandas .dropna(). The function .dropna() has various parameter to set.
The (axis) parameter denotes if the function can be put into rows axis='index' or columns axis='columns'. You can keep the parameter ‘how’ as how='any' or how='all'. It means that the rows and columns can be released if they have null values. The thresh parameter enables you to set the least number of non-null elements inside the row or column that needs to be released. The subset parameter can collect a list of column names and is optional. In case the list is void, .inplace can either be True or False. If it's True, None gets returned.
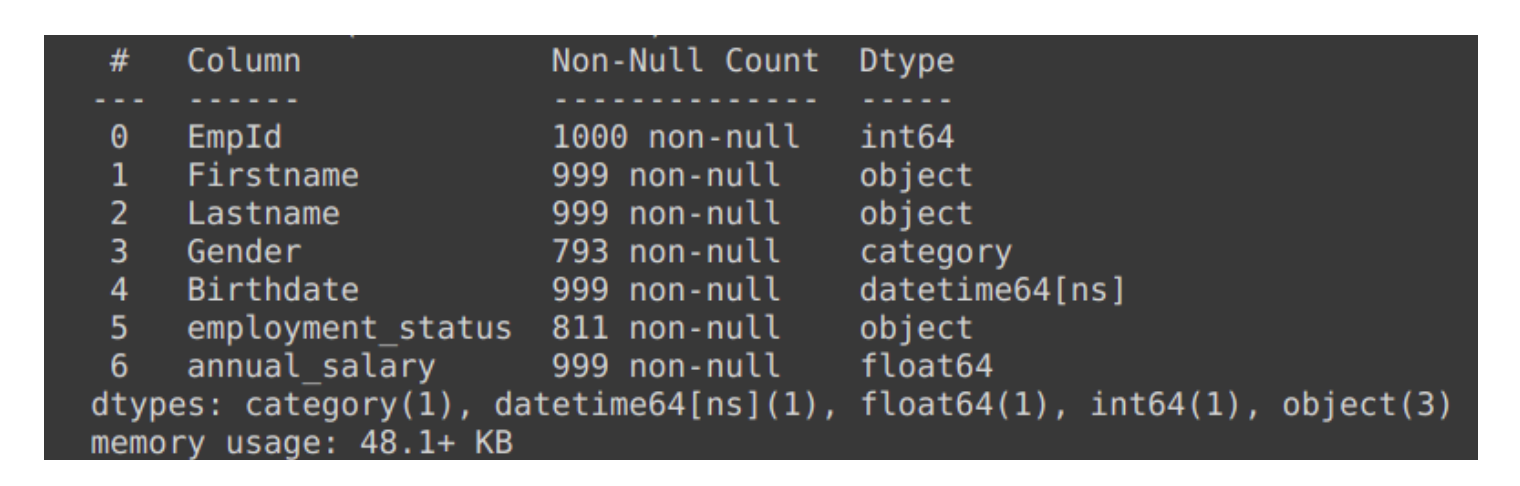
After performing .dropna() and DataFrame info printing out to the console, one can see the column "tax_file_no" no longer exists.
output :
Removal of Rows
After checking null columns, check for rows that don't have sufficient usable elements. You can obtain this by using. dropna(thresh=2) to eliminate all rows that possess less than 2 elements.

In the second line, we are dropping all/any row that has less than 2 elements. Line3 restores all rows from the actual DataFrame that does not have indexes in under_thresh_removed, or dropped rows. It attains this by nullifying ~ pandas built-in .index.isin() function. In this specimen, one record is restored that possess employee number only.
Filling Values that are missing
Many times, you may prefer keeping rows that have missing values. Consequently, you might want to give them any default value.
In this example, we will map the null values inside the gender column to U for Unknown. Pandas offer a deep inbuilt function which is able to obtain this .fillna()
Pandas .fillna() is a robust function to clean and manipulate data or DataFrame. The value parameter will acknowledge a dictionary that will enable you to state values utilized on particular columns to fill all empty values. The bfill method executes a similar function. However, extracting the filling is possible from the next valid value that pops up in the series. Both inplace and axis parameters obtain a similar outcome like the .dropna() function states above. In case you have set the method parameter, utilizing the limit parameter can help you tell .fillna()- the maximum amount of successive null values, thereby checking forward and backward to hit a valid value. In case the method parameter is None, use the limit parameter to set the most number of null values in the series packed by the passed values.
Before mapping the missing values to UN, you will have to generate a fresh category, since the (gender) column includes a category based data type.
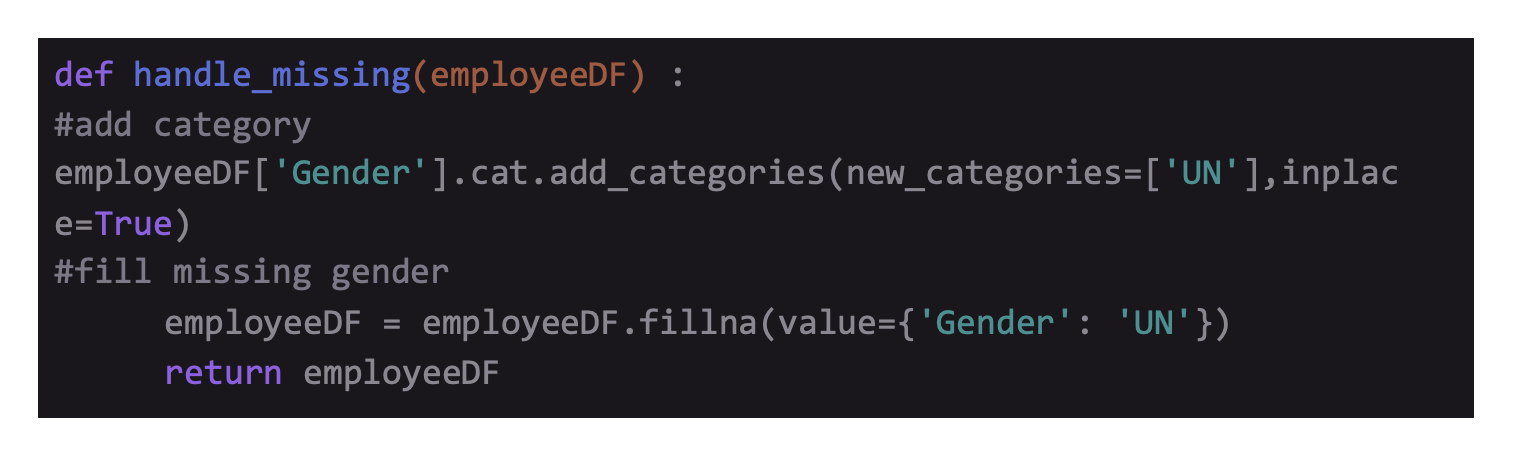
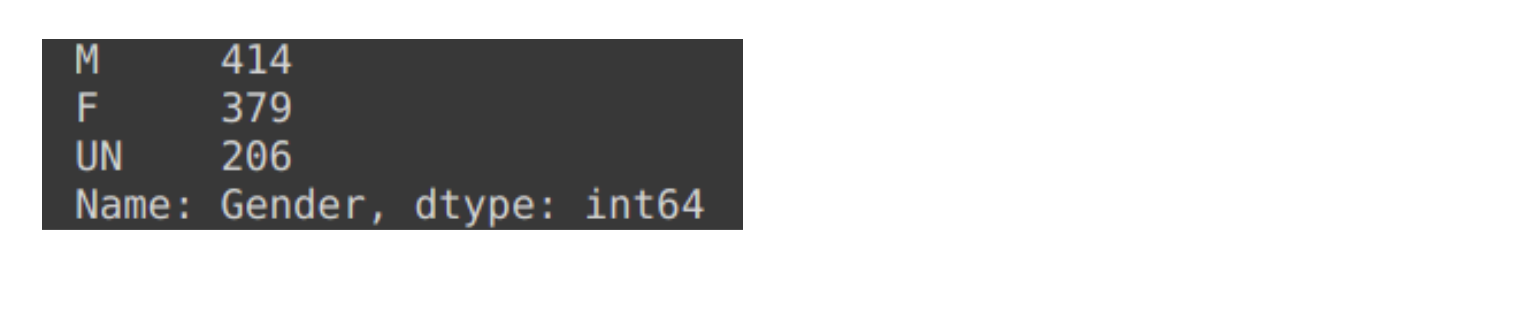
To attach a new category, you need to separate the gender column into a series and call .add_categories(). It will enable you to pass in unique categories using new_categories=[] that acknowledges a list. Once you create a new category, you can use .fillna() and refer to the new category. To look at the alterations, you can call df['gender'].value_counts() that will separate the gender column and offer a value count for every category inside the series.
Improving of Readability
Here, we get a knowledge of the meaning behind M, F, and U categories. Regardless, stakeholders gaining data might not perceive the same. Hence, to enhance the readability of the analysis, you can rename these categories into something different and relevant.
The snippet above utilizes built-in function .rename_categories() that acknowledges a dictionary. This dictionary maps the existing categories into new categories. Below are the rest of the results. To understand the concepts of Data Science you can also check out the courses Data Science Foundation Program (Full Time) and Data Science Foundation Program (Part Time)
That are being offered by NIIT.
All Code :
SHARE


Advanced PGP in Data Science and Machine Learning (Full Time)
Become an industry-ready StackRoute Certified Data Science professional through immersive learning of Data Analysis and Visualization, ML models, Forecasting & Predicting Models, NLP, Deep Learning and more with this Job-Assured Program with a minimum CTC of ₹5LPA*.
Job Assured Program*
Practitioner Designed